Last works
World Population with D3.Js
D3.Js is other Framework that allow create maps, while at the same time it gives to us control over all the objects that we going to draw in SVG. Here you can find a simple but entire example of a D3.JS map.
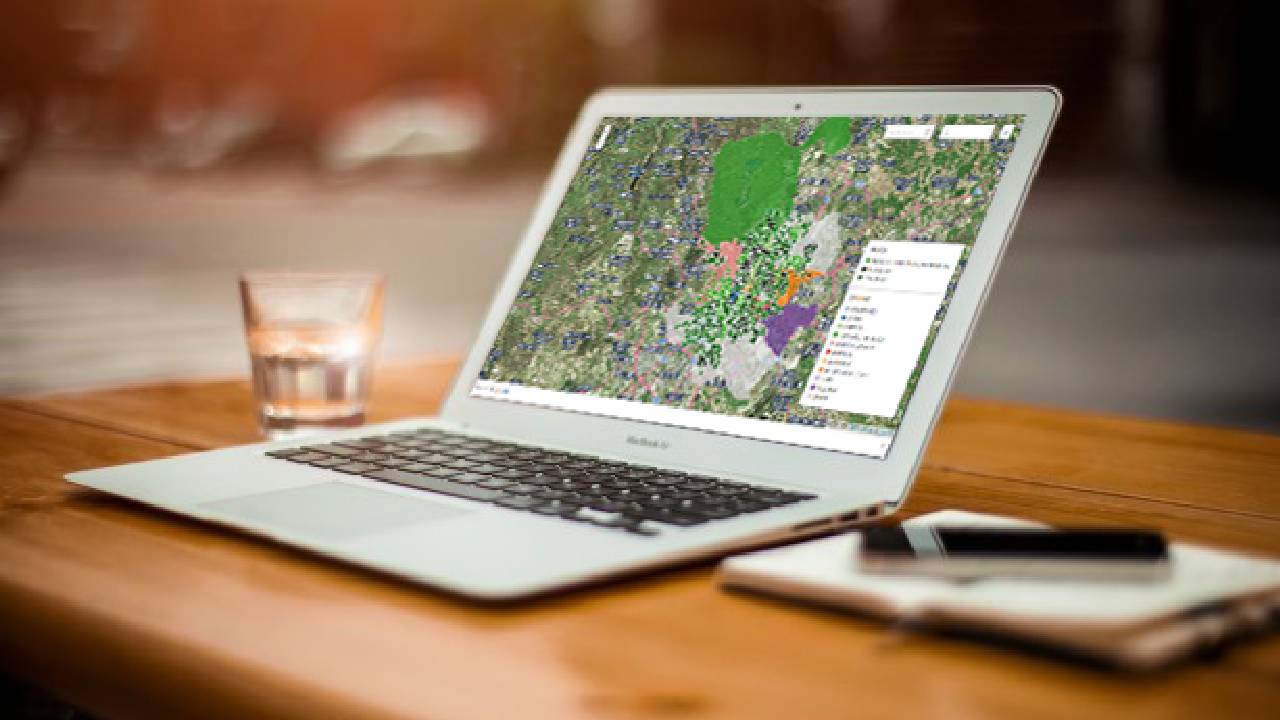
Web Mapping & Charting
With Leaflet and D3JS APIs is possible to make a lot of interactive web maps with associated charts and dynamic information. This maps are very usefullies by represent cleary and easy information, for example
Geolocation: App
Geolocation is an application that I’ve carried out by ESRI JavaScript API. This app has a huge potential in real time geolocation as in study and monitoring. The app can be used for different fields like security, environment and free time among others
Who am I?
Meet me
Knowledges


Experience
Apps and Widgets Development
Web Apps development through ArcGIS API for JavaScript. Creation and implementation of Widgets for Web App Builder
D.I.A. in Geoprocessing
Development Implementation and Automation Geoprocessing or procedures for ArcGis by means of Python code
Advising
Advising with regards to implementation and upgrade your GIS system. Use of Web applications for a better development of GIS environment
Projects
Some of my projects, either already done or underway
-

EEA’s European Environment and Health Atlas
Presents information on how pollution affect the health of Europeans.
-

Geopark: Natural Park Management
Management Natural Park by ESRI technology
-

Urban watershed calculate
Programming at the user's service
-
Madrid's drinking fountains
The Web-Map shows drinking fountains in Madrid's districts.
-

Geolocation
App that allow get a real time position
-

Web Mapping & Charting
Example of Leaflet and D3JS combination
-
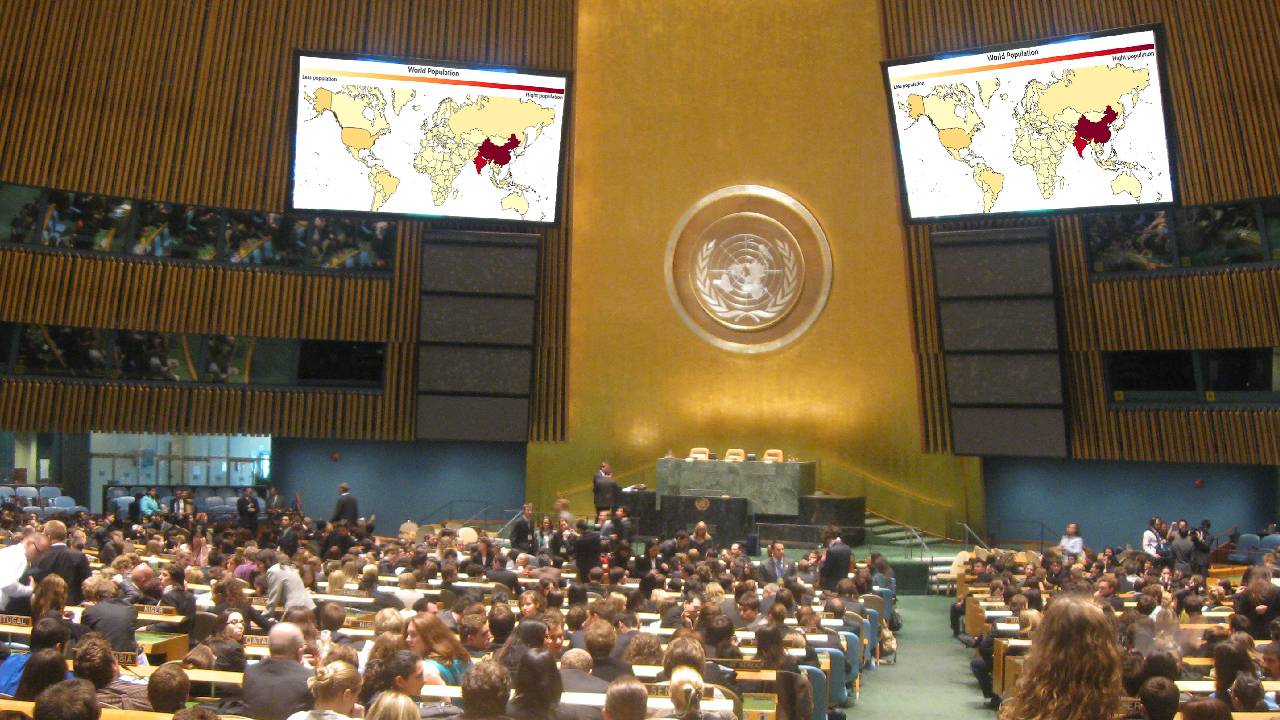
World Population with D3
Using D3.JS to create webmaps
Contact
Could I help you?
Follow me